
Vega Studioを使用したウェブアプリのデバッグ
Vega Studioを使用したウェブアプリのデバッグ
オープンベータ版ドキュメント:本テクニカルドキュメントは、リリース前のオープンベータ版の一部としてAmazonから提供されるものです。ここで説明されている機能は、Amazonがフィードバックを受け取り、機能の開発を繰り返す過程で変更される可能性があります。最新の機能の情報については、最新のリリースノートを参照してください。
Vega Studioは、Vegaアプリ向けの統合開発環境(IDE)です。Chrome DevTools(CDT)と統合してWebViewアプリをアタッチしてデバッグできます。CDTを使用することで、通常のウェブアプリと同様に、レンダリングされたHTMLコンテンツを検査したり、ブレークポイントを設定してJavaScriptをデバッグできます。
Vega Studioを使用してCDTデバッグセッションをセットアップするには、以下のガイドを参考にしてください。
前提条件
- Visual Studio Codeをインストールします。
- Vega Studio拡張機能(0.21以降)をインストールします。
Vegaウェブアプリをデバッグする手順
- Vega Studioでアプリを開きます。
- デバッグバリアントをビルドして起動します。
- 次の2つの方法のいずれかでアプリを起動します。
- コマンドラインから起動
-
Vega Studioサイドバーの [Play] ボタンをタップして起動
注: Chrome DevToolsでデバッグするには、デバッグ用の設定でターゲットアプリをビルドします。
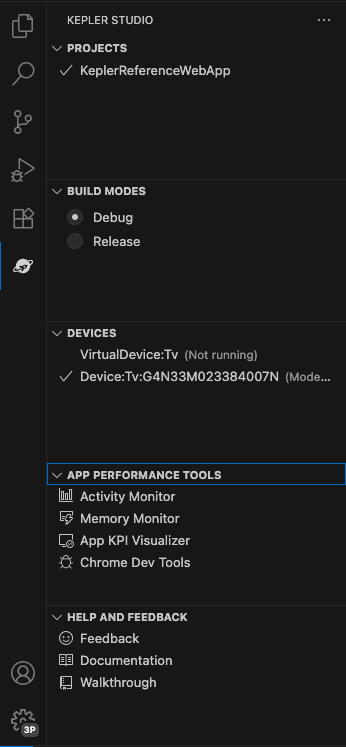
- VegaStudioからChrome DevToolsを起動します。
-
Vega Studioのサイドバーを開き、[Chrome DevTools] をクリックします。
-
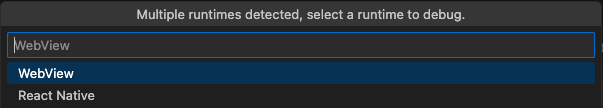
ターゲットランタイムを選択するコンボボックスが表示されます。WebViewで実行されているHTML + JavaScriptコンテンツをデバッグするには、[WebView] を選択します。
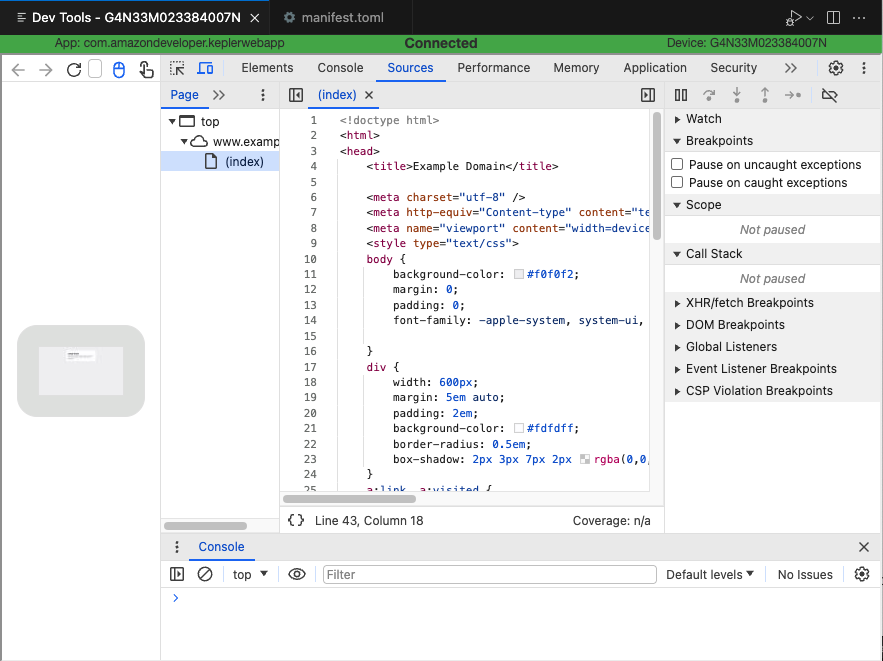
- Chrome DevToolsがエディターに表示され、WebViewランタイムにアタッチされます。HTMLとJavaScriptのソースコードを検査したり、JavaScriptコードにブレークポイントを設定したりできます。
関連トピック
- Chrome DevToolsの詳細については、Chrome DevToolsを使用したアプリのプロファイリングを参照してください。
- Vegaウェブアプリの概要
Last updated: 2026年2月19日