Analyze Your Skill Metrics
To help you understand how users interact with your Alexa skills, Amazon provides tools to generate usage metric reports for each skill. Usage metrics include the number of unique customers, the percentage of users who invoked a particular intent interaction path, and more. To view your skill metrics reports, visit the Analytics page in the Alexa developer console. Alternatively, you can access skill metrics with the Metrics API.
Access the Alexa skill Analytics dashboard
To access the Analytics dashboard in the Alexa developer console and learn how to generate reports, see View Skill Metrics.
Available skill metric categories
Metrics are available for different categories of skills, such as custom or smart home skills. Most metrics are available for skills at both the development and live stages. All metrics data excludes invocations from the Test your skill page in the developer console.
The following table provides an overview of the categories of metrics available for your skills:
| Metric | Description | Skill types |
|---|---|---|
|
Actions |
Unique users per action, total actions, and total utterances per action. |
Smart Home |
|
Customers |
Definition of this metric depends on the type of skill.
|
Custom |
|
Intents |
Unique users per intent, total utterances per intent, total intents, and failed intents. |
Custom |
|
Interaction Path |
Paths users take when interacting with your skill. For example, view the percentage of users who invoked a particular intent after the |
Custom |
|
Play Queues |
Number of play queues, average play queues per customer, total play queue duration, average play queue duration in hours, play queue duration in hours per customer. |
Music, Radio, and Podcast |
|
Playback |
Percentage of play queues that lasted 30 seconds or longer. |
Music, Radio, and Podcast |
|
Plays |
Total number of times that a user played the skill content. |
Flash Briefing |
|
Retention (live skills only) |
Usage of your skill over time by groups of users or cohorts. View the number or percentage of users who returned to your skill over a 12-week period. |
Custom |
|
Sessions |
Total sessions, successful session types (sessions that didn't end due to an error), average sessions per user. Includes a breakdown of successful, failed, and no-response sessions as a percentage of total sessions. |
Custom |
|
Top Media Content |
Most-played content items. |
Music, Radio, and Podcast |
|
Utterances |
Metrics for utterances depend on the skill category.
|
Custom |
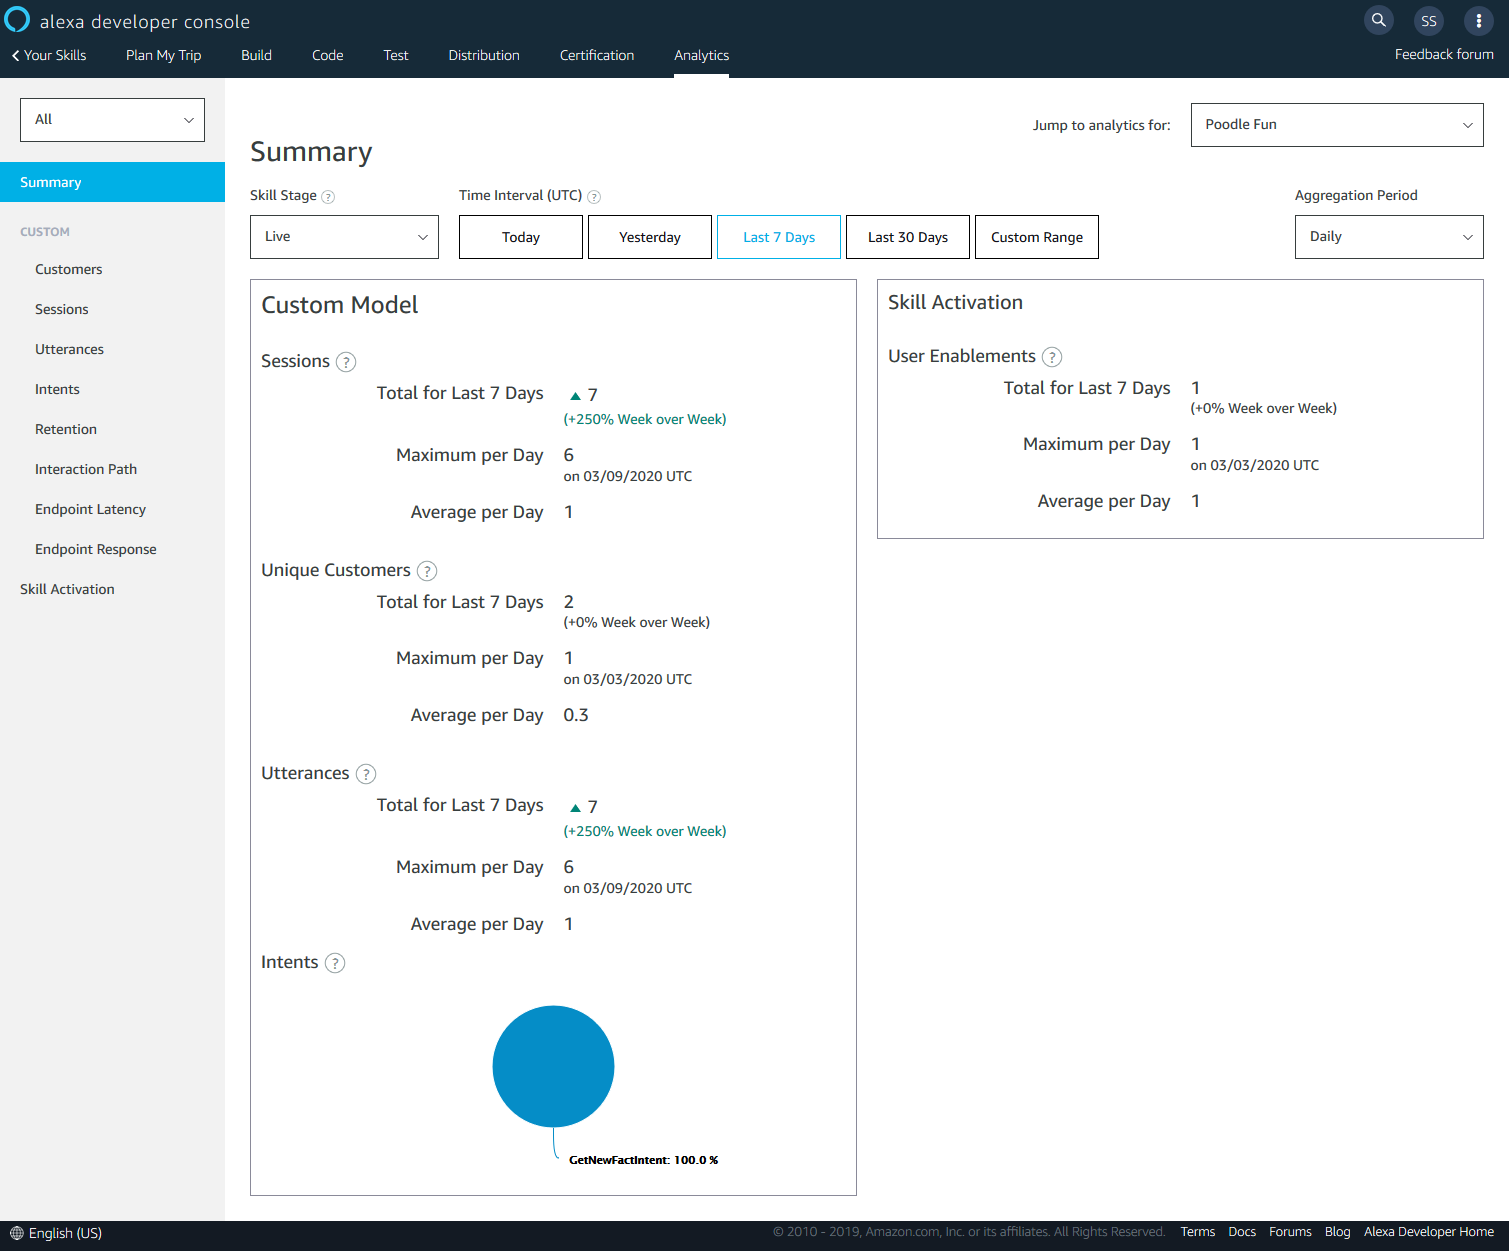
Summary of skill metrics
The Summary section of the Analytics page displays an overview of the metrics available for the skill. For each metric, you have options to view infographic-style charts, grids, or other visualizations. Available metric data export formats are PNG or JPEG images for infographics, or CSV format for raw data.
Skill outage notification
On the Analytics page, the developer console displays a high-severity event banner when Alexa detects that the skill is experiencing an outage. For details about the outage, click Learn More.
Skill activation and token retrieval metrics
For skills that use account linking, the Analytics page has an Account Linking section that displays metrics related to skill activation and token retrieval. These metrics are available for live skills.
To understand these metrics, first learn about account linking initiations and completions. For details, see Add Account Linking for Alexa.
The following table shows the metrics that are available under Skill Activation. These metrics show data up to two days before the viewing time.
| Metric | Description | Skill types |
|---|---|---|
|
Total Enablements |
Definition of this metric depends on the type of skill.
Although some users might enable your skill, they might never launch that skill. Users who launch a skill count as unique user. This behavior can explain a difference between the number of times users enable a skill and the number of unique users. |
Custom (without account linking) |
|
Total Account Linking Events |
Total number of account linking initiations and completions. |
Custom (with account linking) |
|
Account Linking Completion Rate |
Percentage of successful account links. The percentage is the total number of account linking completions divided by the total number of initiations. |
Custom (with account linking) |
Token retrieval metrics
The following table shows the metrics that are available under Token Retrieval. These metrics appear in near real-time (within a few minutes of being emitted).
| Metric | Description | Skill types |
|---|---|---|
| Access Token Requests: Success Rate | Percentage of successful access token requests from the Alexa service to your skill's authorization server. For details, see Overview of the authorization code grant flow. | Custom (with account linking - authorization code grant) Music, radio, or podcast (with account linking) Smart home |
| Refreshing Access Token Requests: Success Rate | Percentage of successful access token refresh requests from the Alexa service to your skill's authorization server. For details, see Overview of the authorization code grant flow. | Custom (with account linking - authorization code grant) Music, radio, or podcast (with account linking) Smart home |
| Access Token Requests: Error Responses | Number of error responses to access token requests from the Alexa service to the authorization server for the skill. For details on errors that come from OAuth 2.0, see Error Response in the OAuth 2.0 authentication framework specification. If the Alexa service receives an OAuth 2.0 error that it doesn't recognize, it displays it as an UNKNOWN_ERROR_CODE. A TRANSIENT_ERROR indicates that the Alexa service wasn't able to communicate with the partner service. For other error situations, Alexa returns a null error. |
Custom (with account linking - authorization code grant) Music, radio, or podcast (with account linking) Smart home |
| Refreshing Access Token Requests: Error Responses | Number of error responses to access token refresh requests from the Alexa service to your skill's authorization server. For details on errors that come from OAuth 2.0, see Error Response in the OAuth 2.0 authentication framework specification. If the Alexa service receives an OAuth 2.0 error that it doesn't recognize, it displays it as an UNKNOWN_ERROR_CODE. A TRANSIENT_ERROR indicates that the Alexa service wasn't able to communicate with the partner service. For other error situations, Alexa returns a null error. |
Custom (with account linking - authorization code grant) Music, radio, or podcast (with account linking) Smart home |
Operational metrics
Use operational metrics to see how your smart home and video skills perform. You can download the data to troubleshoot skill failures and latency issues. For more details, see View Operational Metrics for Smart Home and Video Skills.
On the Analytics page, in the Operational Metrics section, the Discovery, Capability Directives, and State Quality pages display the following metrics for device discovery, device control, and state reporting:
- Latency – After Alexa sends a request to your skill, latency is the time in milliseconds until Alexa receives a response from your skill.
- Skill score – Accuracy rate indicates the percentage of time that the state reported in a response to a
ReportStatedirective matched a previously sentChangeReportevent or directive response. - Success rate – Success rate is the total number of successful responses Alexa receives from your skill divided by the total number of requests Alexa sends to your skill.
- User perceived errors (UPE) – Errors that cause friction to the Alexa user and compromise the user experience, such as when a skill doesn't respond to Alexa with the results of the user request to turn on the lights.
Skill performance metrics
Use skill performance metrics to view how well your skill is functioning.
- Endpoint Latency – Use Endpoint Latency to see how responsive your skill is to user utterances. Skills with low endpoint latency have slow responses and cause friction for users.
- Endpoint Response – The Endpoint Response metric shows the number of successful and failed responses your skill has over time. Skills that have no response confuse users and lower user satisfaction with your skill. If users aren't responding to your skill, your endpoint-response metrics reflect a low score.
- Intent Confidence – The Intent Confidence metric shows how your voice interaction model is performing. The confidence setting options are high, medium, or low. A low confidence request from a user triggers a re-prompt instead of sending the utterance to your skill as an intent request, resulting in a poor user experience.
-
Estimated System Errors – The Estimated System Errors metric estimates the potential success of a conversation turn based on system signals from natural language understanding and context. Use this metric to review utterances that frequently cause failed interactions and to view aggregate skill improvements over time so that you can modify your skill to further improve accuracy.
Note: The Estimated System Errors metric is available for high-traffic skills in en_US, en-GB, and de-DE.
Monetization metrics
Alexa has three payment models for paid skills and custom skills with in-skill products:
- One-time purchase – A single transaction purchase that unlocks access to the skill itself or to premium content within the skill. For example, access to a paid skill or to a new level within a game. A one-time purchase doesn't expire.
- Subscription – A purchase that offers access to your skill or premium-skill content for a period of time, charged on a recurring basis until the customer cancels the subscription. If you offer a free trial, after the trial period ends, access converts to a paid subscription.
- Consumables – (For in-skill products only) A purchase that unlocks access to content, such as in-game currency or extra lives. The customer consumes and depletes the content, and might re-purchase it repeatedly.
The following table shows the metrics that are available under Monetization.
| Metric | Description | Applicable types |
|---|---|---|
|
Total Purchases |
Total number of offers accepted for all purchases within a skill. For consumables, Total Purchases includes repeat purchases by the same user. |
One-time purchases and consumables |
|
Purchases |
Number of offers accepted for each one-time purchase or consumable within a skill. For consumables, Purchases includes repeat purchases. |
One-time purchases and consumables |
|
Offer Impressions |
Total number of times users heard the purchase prompt from Amazon, describing a skill or product and its price, and decided whether to buy. Offer Impressions includes both free-trial and paid offers. For consumables, this metric includes both the first-time purchase and repeat purchases of the same item. Offer Impressions doesn't include messages provided within the upsell directive. |
One-time purchases, consumables, subscriptions |
|
Offer to Purchase Conversion |
The percentage of offer impressions that resulted in a purchase. |
One-time purchases and consumables |
|
Active Subscriptions |
Total number of active subscriptions for your skill, including paid subscriptions with future expiration dates. |
Subscriptions |
|
Trial to Paid Conversion Rate |
Percentage of trial subscriptions that became paid subscriptions. |
Subscriptions |
|
Subscriptions Started |
Total number of new subscriptions. |
Subscriptions |
|
Subscriptions Ended |
The total number of trial subscriptions that a user canceled or paid subscriptions that a user canceled. If a user cancels a paid subscription, the subscription remains active until it expires at the end of the billing period for the user. |
Subscriptions |
|
Churn |
Percentage of active paid subscriptions that expired or that a user canceled. |
Subscriptions |
|
Offer Conversion Rate |
Percentage of offer impressions that resulted in the user signing up for a new trial or paid subscription. |
Subscriptions |
|
Upsell to Offer Conversion |
(For in-skill products only) The percentage of upsell impressions that resulted in a purchase. Upsell to Offer Conversion is available for the upsell directive only. |
One-time purchases, consumables, subscriptions |
|
Upsell to Purchase Conversion |
(For in-skill products only) The percentage of upsell impressions that resulted in a purchase. This metric is available for the upsell directive only. |
One-time purchases, consumables, subscriptions |
Alexa Shopping Actions metrics
Alexa has the following categories of Shopping Actions for custom skills:
- Add-to-Cart action – The customer requests that the skill add the product to their Amazon Shopping Cart. Later, the customer visits Amazon.com to make the purchase.
- Add-to-Wishlist action – The customer requests that the skill add the product to their Amazon Wish List.
- Buy action – The customer purchases the requested product during the skill session.
- Recommend-products action – The customer agrees to learn more about products that your skill recommends.
| Metric | Description |
|---|---|
|
Add to Cart recommendations |
Total number of product recommendations made within the skill. |
|
Add to Cart conversions |
Number of product recommendations that the customer added to their Cart. |
|
Add to Wishlist recommendations |
Total number of product recommendations made within the skill. |
|
Add to Wishlist conversions |
Number of product recommendations that the customer added to their Wish List. |
|
Buy Action recommendations |
Total number of product purchase recommendations made within the skill. |
|
Buy Action conversions |
Number of product recommendations that the customer purchased. |
|
Number of product recommendations |
Total number of product recommendations made within the skill by using the Recommend-products action. |
|
Recommend products Add-to-Cart conversions |
Number of product recommendations that the customer added to their Cart. |
|
Recommend products Buy conversions |
Number of product recommendations that the customer purchased. |
Customer friction metrics
Use customer friction metrics to see how users interact with your skill. Alexa uses various user interaction patterns and other contextual signals to predict if a user experienced friction when interacting with your skill.
-
Customer friction summary – Use the Customer friction summary dashboard to see relative trends for your skill plus a list of frequent utterances that Alexa has identified as causing potential customer friction.
-
Barge-ins – Use the Barge-ins metric to see how often user interrupt an ongoing skill response. High barge-in rates could have causes, such as long skill responses, unexpected up-selling options, or not allowing enough time for a user to respond to a prompt.
-
Terminations – Use the Terminations metric to see the number of times users prematurely end a skill session. Premature termination causes include a user making a request that's out of scope for the skill, an incorrect slot recognition, or an incorrect use of Name Free Invocation.
-
Unhandled Requests – Use the Unhandled Requests metric to see the number of times your skill is unable to handle user requests. New user requests that might be relevant for your skill can contribute to these unhandled requests.
Related topics
- View Skill Metrics
- Interpret and Troubleshoot Skill Performance Metrics
- Troubleshoot Smart Home and Video Endpoints with Message IDs
- Skill Metrics FAQ
Last updated: Jul 14, 2026